- October’s measured historical performance, and why it could be a decisive month.
- US jobs data to land overnight and Friday, unexpected results could drive volatility.
- Altcoin analysis: SUI and SEI.
Bitcoin and other cryptocurrencies have had a rocky start to the new quarter. On October 1st, Bitcoin dropped by -3.9%.
Early this morning Bitcoin’s price tagged below $60,000 US briefly, where it currently trades back above this value.
Fear and greed currently reads 39 – Fear.
Impactful US Jobs Data to Come
For the remainder of this week we have impactful jobs data coming out of the US starting tonight at 10:30pm AEST and again on Friday at 10:30pm AEST. With the focus moving away from inflation risks as was addressed in US Fed Chair Powell’s speech earlier this week the results of growth data in the coming weeks will be telling in future policy decisions.
October Effect
The month of October has held as a key battleground period between bulls and bears in the past.
 Source: Crypto Rank – Historical performance of Bitcoin.
October has traditionally been a positive month for Bitcoin, with an average return of +14%. It’s also the first month of Q4 and historically we can see that November has returned on average +40% and December +9% respectively on Bitcoin since 2011.
While prior performance doesn’t guarantee future outcomes, it does set the stage for what is possible during this period.
Related: SEC Files Appeal in Ripple Case, Chief Legal Officer Says Ripple Considers Cross Appeal
Bitcoin – BTC
After an explosive move to end September, Bitcoin has started the new quarter and month to the downside where we now find price hovering around the previous lows from where the most recent breakout started (blue box). Below are two possible outcomes from here.
 Source: TradingView
Bullish Scenario
The previous lows (blue box) remains an active area of support where we see bulls continue to show their sponsorship back upwards.
Bearish Scenario
Little interest garnered here from the bulls, which could result in a further sell-off back below $60,000 USD.
Related: Franklin Templeton Brings $435 million Tokenised Money Market Fund to Aptos Blockchain
Sui – SUI
Some of the regulars amongst the top performers these last few weeks is SUI. A layer 1 infrastructure token pushing back through its trading range at a fast pace. When we measure the current range since April using Fibonacci ratios, we can see it has surpassed the golden ratio of 0.618 and is nearing new local highs.
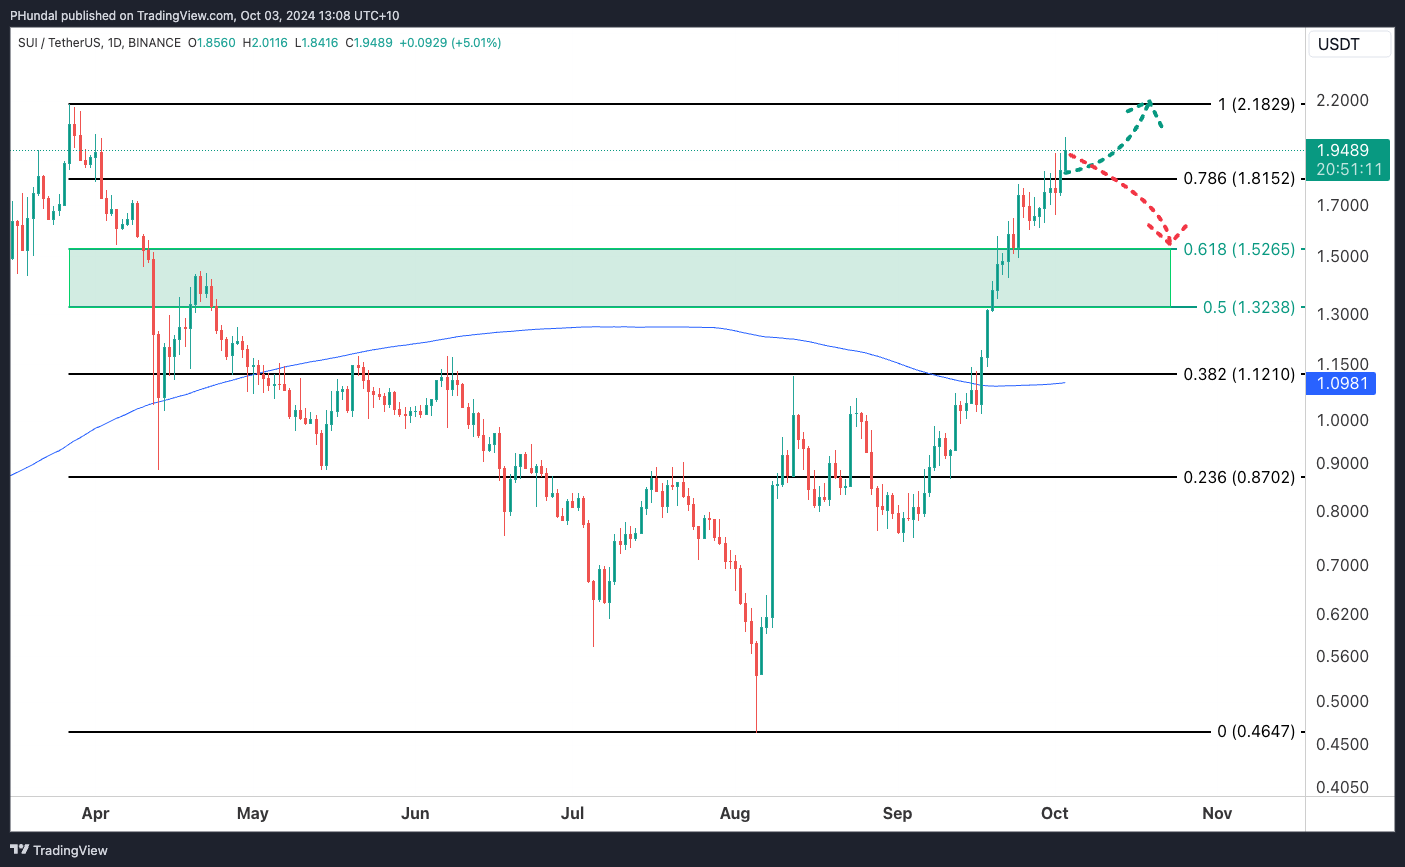 Source: Tradingview
 Bullish Scenario
Bulls continuing to bid on SUI could see it move back to previous highs of $2.18.
Bearish Scenario
An influx of selling activity or lack of buyers at these prices may result in a retracement back towards the golden 0.618 fib level.
Sei – SEI
A L1 chain competing with SUI, SEI’s price action is a little less developed than its competitor when talking technical analysis. Using a Fibonacci measurement we get the below chart.
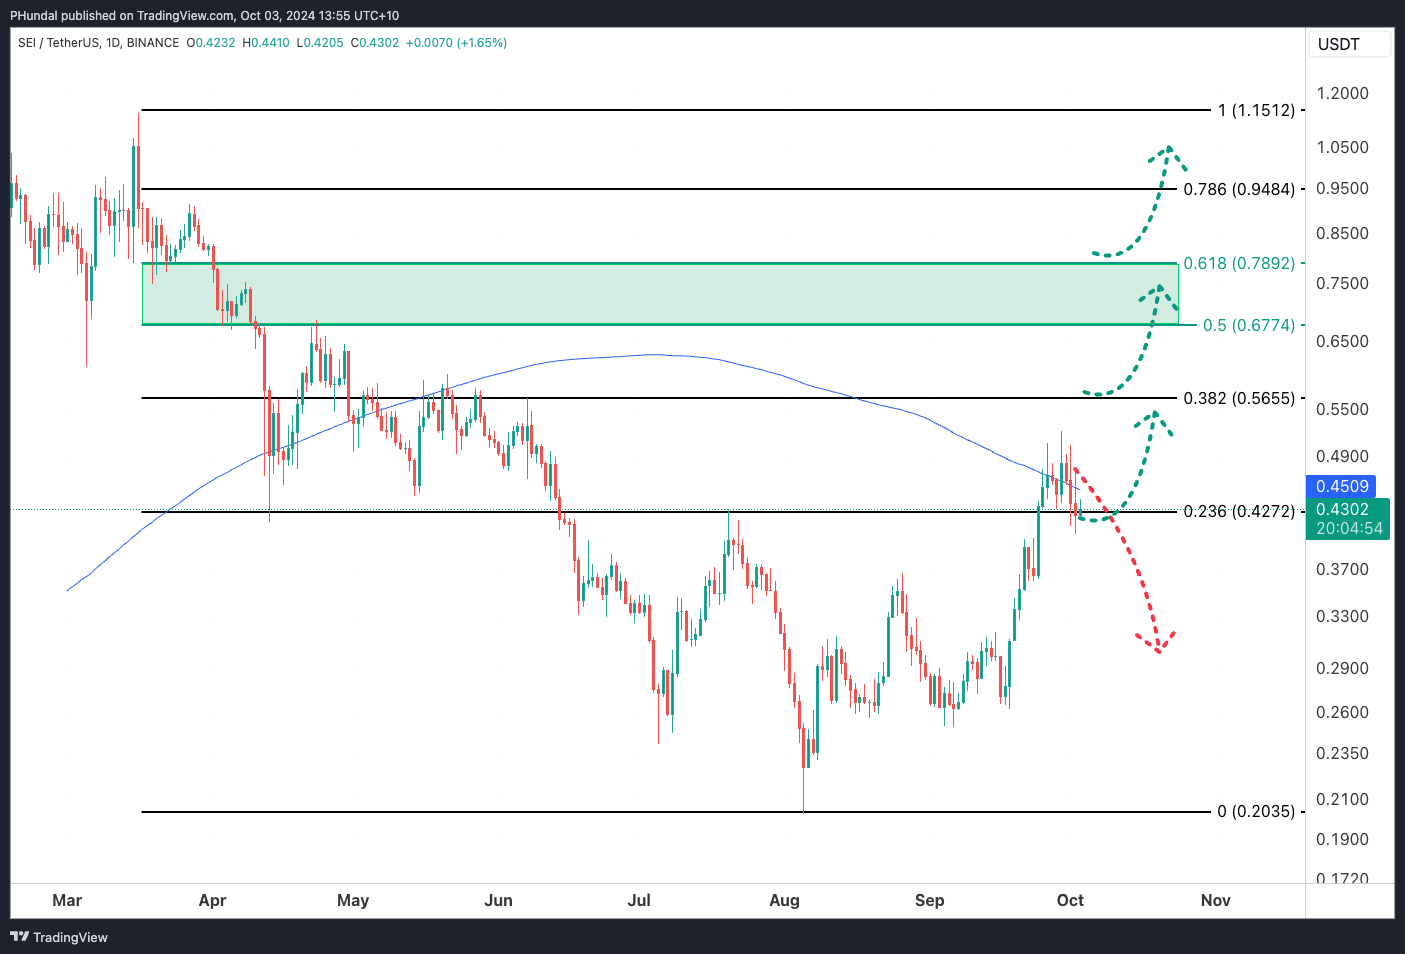 Source: TradingView
Bullish Scenario
Being in the same category as SUI, and lower market cap the price action could be trailing behind. If this was the case, I would expect bulls to bid and move SEI level by level towards the golden fib level of 0.618 ($0.78).
Bearish Scenario
Failure to find any interest here from buyers could result in SEI losing the 0.236 fib level, and retracing lower.
Keep up to date.
Stay informed and connected! Subscribe to Crypto with Pav on YouTube, where I dive into the latest trends in cryptocurrency, offering insights on what’s coming next and highlighting news and technical structure I believe is crucial.
You can also follow me on X.
Cheers!
The post On the Radar – Coins to Watch: SUI and SEI appeared first on Crypto News Australia.